
Core Web Vitals Optimization: How to Pass INP, LCP and CLS and Protect Your Rankings
Core web vitals optimization made practical: diagnose and fix INP, LCP and CLS failures on WordPress and Next.js sites and protect the rankings you have earned.

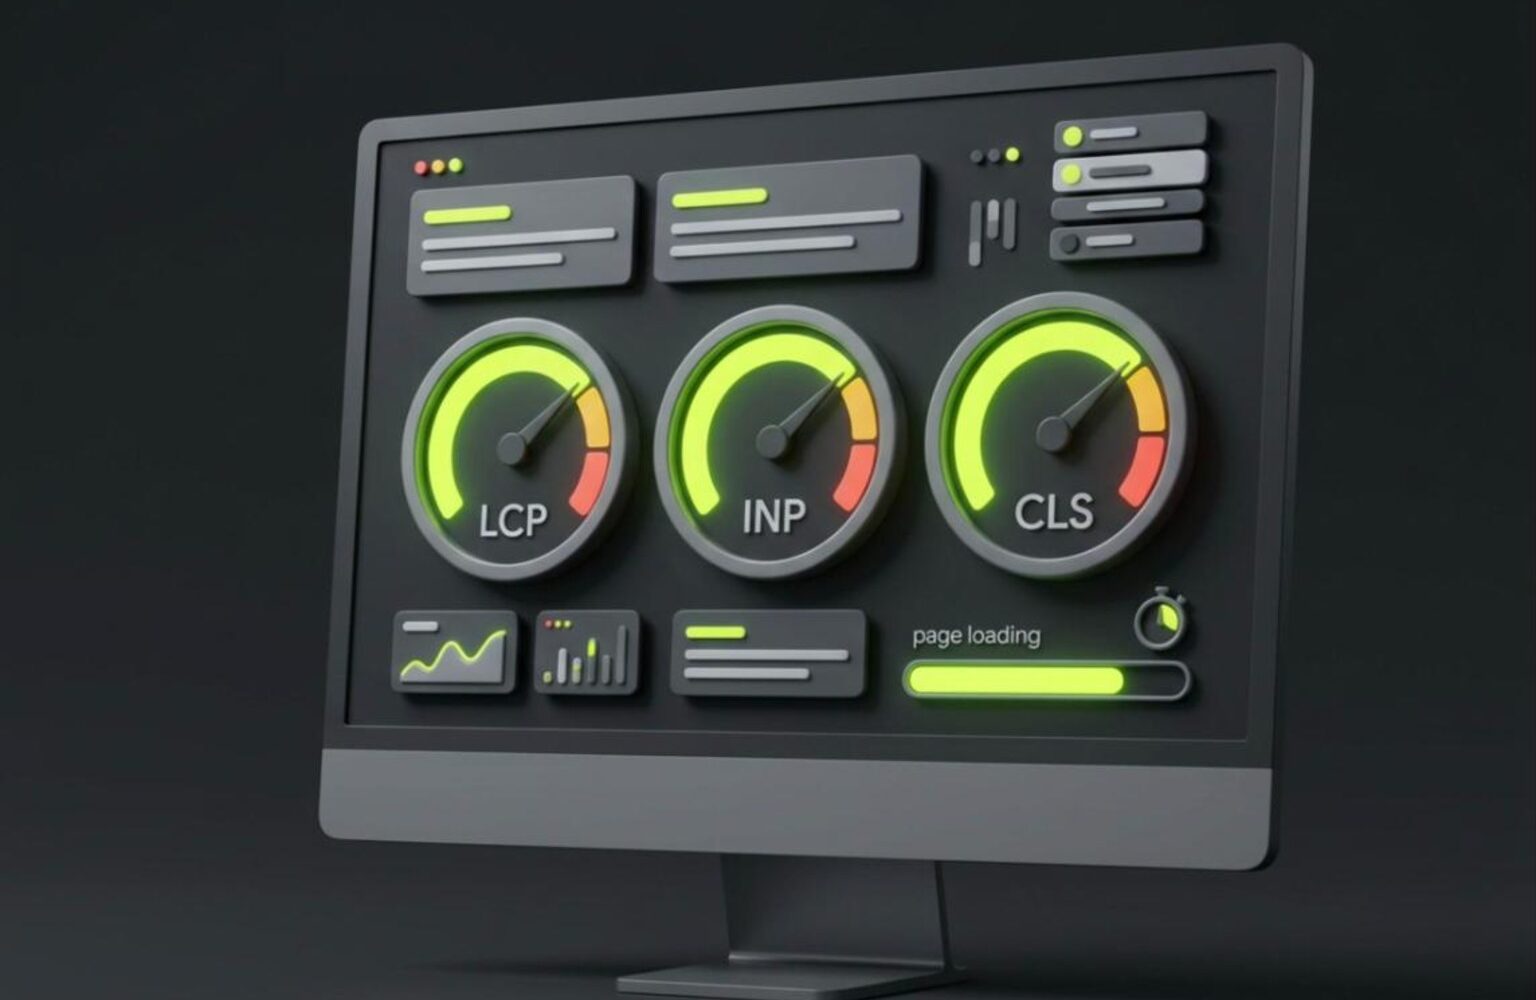
Core web vitals optimization is the process of making your pages load fast, respond instantly and stay visually stable, measured against three thresholds Google uses as a ranking signal. Most small business sites fail at least one of them, and the failure is rarely where owners expect it. This guide walks through diagnosing each metric with real data, then fixing it on WordPress and Next.js, in the order that moves the numbers fastest.
We build and audit sites for small businesses and startups, and the pattern is consistent. Loading speed gets all the attention, while Interaction to Next Paint quietly fails because of third-party scripts nobody remembers installing. Fix the right thing first and you can pass in days, not months.
What Core Web Vitals Measure and the Thresholds You Must Hit
Core Web Vitals are three field metrics that describe real user experience. Google evaluates them at the 75th percentile of real visits, which means three out of four of your visitors must have a good experience for a page to pass. The official definitions live on web.dev.
| Metric | What it measures | Good | Needs improvement | Poor |
|---|---|---|---|---|
| LCP (Largest Contentful Paint) | Time until the main content element renders | 2.5s or less | 2.5s to 4s | Over 4s |
| INP (Interaction to Next Paint) | Delay between a user action and the next visual update | 200ms or less | 200ms to 500ms | Over 500ms |
| CLS (Cumulative Layout Shift) | Unexpected movement of visible elements | 0.1 or less | 0.1 to 0.25 | Over 0.25 |
INP replaced First Input Delay as the responsiveness metric in March 2024. That change matters because FID only measured the delay before the first interaction began. INP measures every interaction across the whole visit and reports one of the worst, so a single sluggish menu or form can sink an otherwise fast page.
Pass or fail is assessed per page group and per device type. Mobile is where most small business sites fail, because phones have slower CPUs and the field data reflects that. Always start your diagnosis on mobile.
Why Core Web Vitals Still Matter for Rankings in 2026
Core Web Vitals are part of Google’s page experience signals. They are not the strongest ranking factor, and Google has said relevance and content quality outweigh them. But they act as a tiebreaker, and in competitive local and service searches, tiebreakers decide positions three through eight.
The bigger business case is conversion. Slow or janky pages lose visitors before your content gets a chance. A page that shifts under a thumb causes mis-taps. A page that ignores a tap for 600ms feels broken, and people leave. Treat core web vitals optimization as a conversion project that also helps SEO, and the budget conversation gets easier.
There is also a defensive angle. When a competitor passes and you fail, you hand them a small but real advantage on every shared keyword. Passing removes that handicap. If you are also working on structural problems, our technical SEO audit checklist covers the other issues that quietly drag rankings down.
Finally, AI search products and answer engines tend to cite pages that load reliably and render cleanly. Fast, stable pages are easier to crawl and parse. That is a secondary benefit, but it compounds.
How to Diagnose Failures with Field Data First
Diagnose with field data before touching any code. Lab tools simulate a single load on a single device. Field data shows what real visitors experienced over the previous 28 days, and it is what Google actually uses.
Work through these sources in order:
- Search Console Core Web Vitals report. It groups URLs by issue and device. Start here to find which templates fail, such as product pages, blog posts or the homepage.
- PageSpeed Insights. Paste a failing URL and read the field data panel at the top, not the lab score. If the URL lacks enough traffic, it falls back to origin-level data.
- CrUX data. The Chrome UX Report is the underlying dataset. It is public and documented on Chrome for Developers.
- Real user monitoring. The free
web-vitalsJavaScript library reports metrics from your own visitors to your analytics, with attribution data showing which element or script caused the problem.
Then move to lab tools to reproduce and fix. Lighthouse in Chrome DevTools and the Performance panel let you trace exactly what happened. Never trust a Lighthouse 100 if field data says you fail. They measure different things.
One rule saves hours: group failing URLs by template. Fixing the blog post template fixes 200 URLs at once. Fixing individual URLs does nothing at scale.
Fixing LCP: Get the Main Content on Screen Faster
Largest Contentful Paint is usually a hero image, a large heading block or a banner. To fix it, you must first know which element it is and where the time goes. DevTools and PageSpeed Insights both name the LCP element and break its timing into four parts: time to first byte, resource load delay, resource load duration and render delay.
Most small business sites lose time in two places.
- Slow server response. If TTFB exceeds 800ms, no front-end fix will save you. Upgrade hosting, enable full-page caching and put a CDN in front of the site.
- Late discovery of the hero image. The browser cannot download what it has not found. Lazy loading the hero image is the single most common self-inflicted LCP wound.
The fixes that work, in priority order:
- Remove
loading="lazy"from the above-the-fold image and addfetchpriority="high". - Serve modern formats (AVIF or WebP) at the correct rendered dimensions.
- Preload the LCP image if it is referenced in CSS or injected by JavaScript.
- Inline critical CSS and defer the rest so rendering is not blocked.
- Cut render-blocking font requests with
font-display: swapand preloaded WOFF2 files.
For a deeper WordPress-specific walkthrough, see our guide to WordPress speed optimization, which covers caching, image pipelines and hosting choices in detail.
Work with Lucanix
Ready to find out which Core Web Vitals you are failing?
We run a field-data audit of your site and tell you exactly what to fix first, with no obligation.
Interaction to Next Paint: The Metric Most Sites Fail Now
Interaction to Next Paint is the hardest of the three to pass because it depends on your JavaScript, not your images or your server. It records the time from a click, tap or key press until the browser paints the next frame. Every interaction counts, and the reported INP is close to the slowest one in the visit.
Each interaction has three phases, and knowing which one is slow tells you the fix:
- Input delay: the main thread was busy with other work when the user tapped. Cause: long tasks from scripts running at the wrong moment.
- Processing time: your event handlers ran for too long. Cause: heavy handler code or synchronous work.
- Presentation delay: rendering the result took too long. Cause: large DOM, expensive style recalculation or layout thrashing.
The practical cause on small business sites is almost always the same: too many third-party scripts. Chat widgets, tag managers loaded with a dozen tags, heatmaps, review badges, cookie banners and social embeds all compete for the main thread. Each looks harmless alone. Together they produce long tasks that block every tap.
Anything over 50ms on the main thread is a long task. Your goal is not zero long tasks. It is making sure no long task is running when a visitor is most likely to interact, and that your own handlers finish quickly. The official guidance is documented at web.dev/inp.
How to Debug and Fix INP Step by Step
Debugging Interaction to Next Paint requires tracing real interactions. Open Chrome DevTools, go to the Performance panel, start recording, then click through your slowest-feeling elements: menus, accordions, filters, add-to-cart buttons, form fields. Stop recording and look for interactions flagged with long durations.
Follow this sequence:
- Find the worst interactions. Use the Interactions track in the Performance panel, or the
web-vitalsattribution build to log the slowest interaction target from real users. - Identify the phase. Expand the interaction and see whether input delay, processing or presentation dominates.
- Audit third-party scripts. In the main thread flame chart, group by domain. Anything from a vendor taking over 50ms in a task is a suspect.
- Remove, delay or replace. Delete scripts you do not use. Load non-essential ones after first interaction or on idle. Replace heavy widgets with lightweight alternatives.
- Break up your own long tasks. Split heavy work into chunks and yield to the browser between them.
- Re-test in the field. Field data takes 28 days to fully refresh, so use lab traces and RUM to confirm sooner.
For yielding in your own code, the simplest pattern is awaiting a short timeout or using scheduler.yield() where supported, so the browser can respond to input between chunks of work. Also keep visual feedback instant: update the button state first, then do the expensive work.
Presentation delay is fixed by reducing DOM size. Pages with more than 1,500 nodes tend to struggle. Remove hidden duplicate mobile menus, avoid deeply nested page builder wrappers and use content-visibility: auto on long below-the-fold sections.
Fixing CLS: Stop Layout Shifts at the Source
Cumulative Layout Shift measures how much visible content moves unexpectedly. It is usually the easiest of the three metrics to fix, because the causes are few and obvious once you look.
The common culprits and their fixes:
- Images and video without dimensions. Always set
widthandheightattributes, or use CSSaspect-ratio, so the browser reserves space before the file loads. - Ads, embeds and iframes. Reserve a fixed-size container using
min-height. A shifting ad slot or YouTube embed is a classic offender. - Web fonts. A fallback font swapping to a wider custom font reflows text. Use
size-adjustand related font metric overrides, or choose a fallback that closely matches. - Injected banners. Cookie notices, promo bars and sticky headers that push content down after load. Overlay them with fixed or absolute positioning, or reserve their space in the layout.
- Late-loading content above existing content. Never insert new elements above content the user is already reading, unless it responds to a tap.
To find shifts, use the Layout Shift Regions option in DevTools rendering settings, or the Layout Shift track in the Performance panel. It highlights what moved and by how much. Remember that CLS is also measured across the full visit in field data, so shifts that happen on scroll, such as lazy-loaded images without reserved space, count too.
Animations are safe if they use transform and opacity. Animating top, height or margin triggers layout and can register as a shift.
Core Web Vitals Optimization on WordPress
WordPress sites fail Core Web Vitals mainly because of plugin and theme bloat, not WordPress itself. A clean install on good hosting passes easily. The failures arrive with page builders, sliders, social feeds and a stack of plugins each loading their own CSS and JavaScript on every page.
A practical WordPress sequence:
- Fix hosting and caching first. Use a host with server-level caching, PHP 8.2 or newer and a CDN. This alone often cures TTFB and LCP.
- Audit plugins by impact. Use Query Monitor or the DevTools Network panel to see which plugins load assets site-wide. Remove, replace or restrict them to the pages that need them.
- Control script loading. Use a plugin or snippet to defer or delay non-critical JavaScript, and disable unused features such as emoji scripts and embeds.
- Optimize images properly. Convert to WebP or AVIF, set dimensions and exclude the LCP image from lazy loading.
- Simplify the theme and builder output. Heavy page builders generate deep DOM trees that hurt INP. Consider lighter blocks or a leaner theme for key templates.
This is where the build approach matters. Templates and stacked builders carry a performance tax that is hard to remove later. We compare the trade-offs in custom WordPress development vs templates, and speed is one of the clearest differences.
Ongoing care matters too. Plugins update, new scripts get added and scores drift. A good website maintenance plan includes performance monitoring so regressions get caught before rankings slip.
Work with Lucanix
Lucanix fixes Core Web Vitals for WordPress and Next.js sites.
We diagnose with field data, fix the root causes and verify the results, for a fixed price.
Core Web Vitals Optimization on Next.js
Next.js gives you strong defaults, but it is not immune. Teams ship slow Next.js sites by overusing client components, loading heavy libraries and misconfiguring images. The framework provides the tools; you still have to use them correctly.
The highest-impact moves:
- Use the Image component correctly. The
next/imagecomponent handles sizing, modern formats and lazy loading. Set thepriorityprop on your LCP image so it preloads and is never lazy loaded. - Default to Server Components. Every client component ships JavaScript that hydrates and competes for the main thread. Keep interactivity in small client islands and render everything else on the server. This is the most effective INP lever in the App Router.
- Load third-party scripts with
next/script. Use thelazyOnloadorafterInteractivestrategies, and consider offloading analytics and tags to a worker. - Use
next/font. It self-hosts fonts, removes external requests and applies size adjustments that reduce CLS automatically. - Split heavy components. Use dynamic imports for modals, charts, editors and maps so they load only when needed.
- Watch hydration cost. Large client trees hydrate slowly and block early interactions. Streaming with Suspense helps the page become interactive in pieces.
Cache aggressively with static generation or incremental regeneration so TTFB stays low. If you are weighing frameworks, our comparison of Next.js vs WordPress explains where each platform’s performance ceiling sits, and React vs Next.js covers the rendering model differences.
A Monitoring Routine That Keeps You Passing
Passing once is not enough. Scores drift every time someone adds a script, uploads a huge image or installs a plugin. The fix is a lightweight routine that catches regressions early.
Run this cadence:
- Weekly: check the Search Console Core Web Vitals report for new groups moving from good to needs improvement.
- Before every release: run Lighthouse on key templates and compare against the previous build. Block deploys that add large long tasks.
- Monthly: review third-party scripts. Ask what each one earns you. If you cannot name the benefit, remove it.
- Continuously: collect RUM data with the
web-vitalslibrary so you see INP problems in specific interactions, not just aggregate scores.
Set performance budgets: a maximum JavaScript size per page, a maximum number of third-party requests and a hard cap on image weight. Budgets turn performance from a one-off project into a standing rule.
Measure the business effect too. Track conversion rate and bounce rate before and after fixes, segmented by device. That is how you prove the work paid for itself, and our framework for measuring SEO ROI shows how to connect technical gains to revenue.
Common Mistakes to Avoid
Most failed optimization projects fail for the same handful of reasons. Avoid these and you save weeks.
- Chasing the Lighthouse score. A perfect lab score with failing field data means nothing. Optimize for field metrics.
- Fixing individual URLs. Fix templates. One template change can repair hundreds of pages.
- Lazy loading everything. It helps below the fold and hurts the LCP element. Exclude the hero.
- Stacking optimization plugins. Three caching and minification plugins fighting each other cause bugs and add overhead. Use one well-configured solution.
- Ignoring INP until it fails. It is the metric most sites now fail, and it depends on third-party code you may not control. Audit scripts early.
- Testing only on a fast desktop. Throttle the CPU to 4x or 6x slowdown and test on a real mid-range phone.
- Expecting instant results. The field data window is 28 days. Fix, verify with lab and RUM data, then wait for the report to catch up.
The honest summary: core web vitals optimization is mostly about removing things, not adding them. Fewer scripts, lighter pages, reserved space and a fast server beat any clever trick.
Frequently Asked Questions
What are the Core Web Vitals thresholds in 2026?
A page passes when, at the 75th percentile of real visits, LCP is 2.5 seconds or less, INP is 200 milliseconds or less and CLS is 0.1 or less. All three must be in the good range for the page to pass. Thresholds are assessed separately for mobile and desktop.
What is Interaction to Next Paint and why does it matter?
Interaction to Next Paint measures how quickly a page visually responds after a user clicks, taps or types. It replaced First Input Delay in March 2024 and covers every interaction in a visit, not just the first. A poor INP makes a site feel sluggish and is now the most commonly failed Core Web Vital.
How long does it take to see Core Web Vitals improvements in Search Console?
Search Console uses a rolling 28-day window of field data, so improvements appear gradually and can take up to a month to fully register. You can confirm fixes sooner with Lighthouse traces and real user monitoring while the report catches up.
Do Core Web Vitals directly affect Google rankings?
Yes, as part of Google’s page experience signals, but they are a modest factor. Content relevance and quality matter more. Core Web Vitals work best as a tiebreaker between similar pages, and they also improve conversion rates, which is often the larger financial benefit.
Is WordPress or Next.js better for passing Core Web Vitals?
Either can pass. Next.js has strong performance defaults but can fail through heavy client-side JavaScript. WordPress fails mainly through plugin and page builder bloat. A well-built, well-hosted site on either platform passes; a poorly built one on either fails.
What is the fastest fix for a failing INP score?
Audit and remove third-party scripts. Chat widgets, extra tracking tags and social embeds are the most common cause of long main-thread tasks. Removing or delaying them until after first interaction often brings INP under 200 milliseconds without any code changes.
Work with Lucanix
Get a Core Web Vitals audit that tells you exactly what to fix
Book a free consultation or request a fixed-price proposal, and we will show you which metrics are failing, why and how fast we can get your site passing.